
Bitcoin Pizza Index
📈 European visitors: Buy Bitcoin safely and easily at one of Europe's leading exchanges.

The Bitcoin Pizza Index is now at
$634,304,453!
What is the Bitcoin Pizza Index?
The Bitcoin Pizza Index is derived from the first documented purchase using Bitcoins.
On May 18th 2010 Laszlo Hanyecz made known on a forum at bitcointalk.org that he was willing to buy 2 pizzas for a price of 10,000 Bitcoins. At the time this was worth $41. Four days later on May 22nd the transaction took place. Forum member Jeremy Sturdivant from California took him up on the deal and had two Papa John's pizzas delivered to Laszlo in Florida. This date has become known as Bitcoin Pizza Day.
The index is the value of 10,000 Bitcoins at today's market price. The index illustrates the deflationary properties of Bitcoin.

So what are those 10,000 Bitcoins worth in terms of other commodities and currencies?
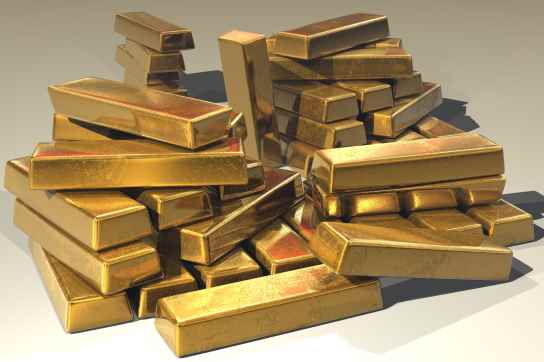
10,000 BTC in Gold
10,000 Bitcoins are now worth 156,832 troy ounces gold.
That is about 4,878 kg!
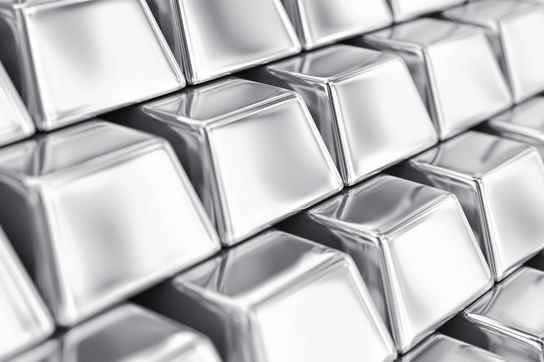
10,000 BTC in Silver
10,000 Bitcoins are now worth 11,004,212 troy ounces silver.
That is about 342 metric tons!
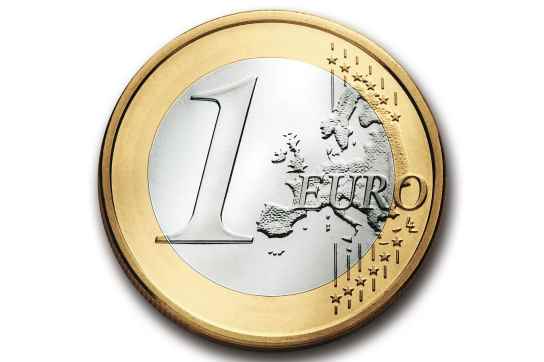
10,000 BTC in Euro
Today, € 550,014,906 can buy you 10,000 Bitcoins.
How did the first Bitcoin purchase take place?
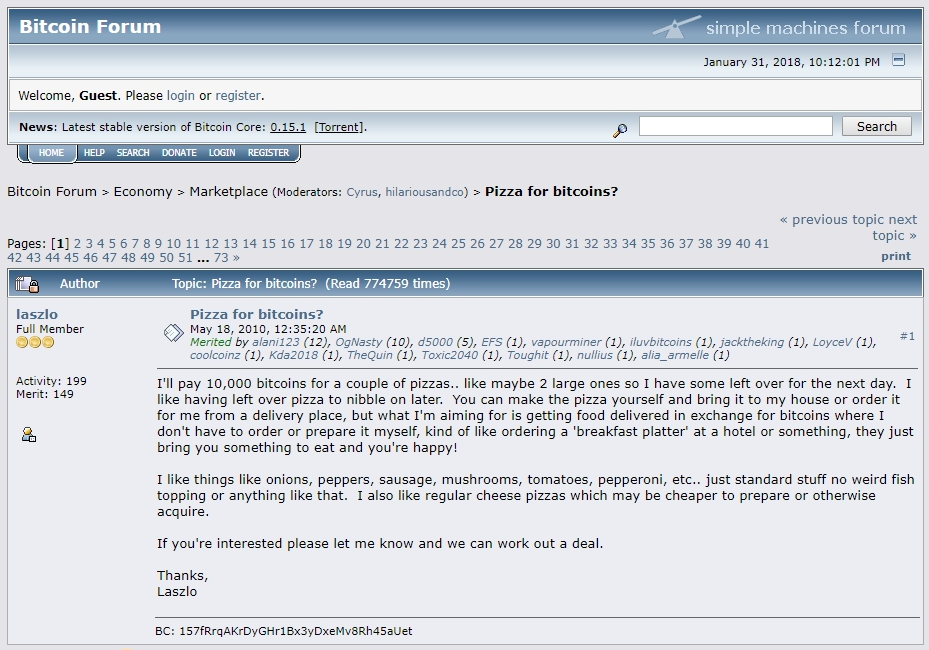
The URL below links to the actual forum where supply and demand met, resulting in the first marketplace for goods paid with Bitcoin.
https://bitcointalk.org/index.php?topic=137.0
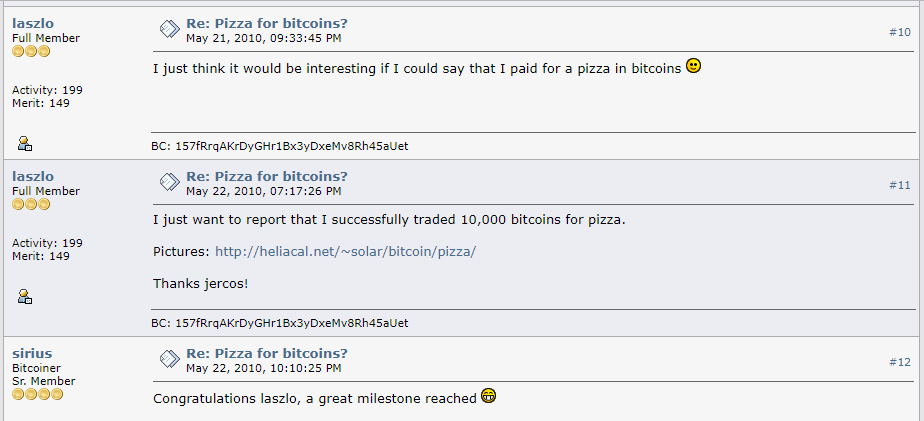
Bitcoin for Pizza?
Laszlo makes known he is willing to pay for pizza with Bitcoin. The conditions are quite simple: Pizza in exchange for Bitcoin.
Transaction complete!
Laszlo reports of the succesful exchange...
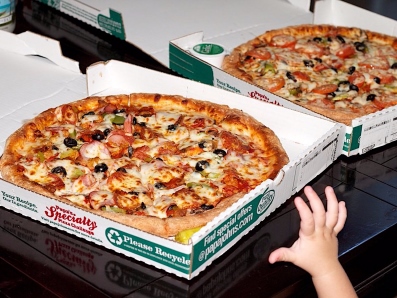
The actual pizzas bought with 10,000 Bitcoins!
...and includes a picture of his recent purchase.
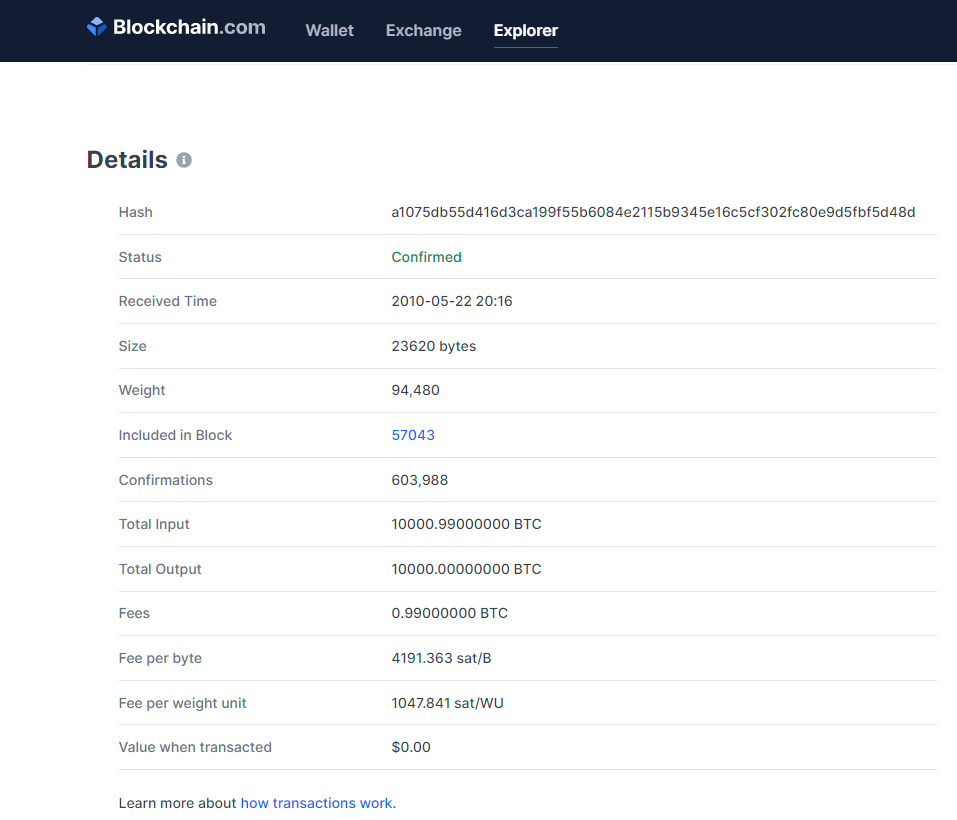
The transaction for the pizzas in the blockchain:
Blockchain.com offers various financial services related to cryptocurrency and with their Bitcoin Explorer it is possible to see individual transactions in the blockchain. Below is the actual transaction of the Bitcoin Pizza.
Quote by Jeremy Sturdivant
Jeremy was the recipient of the 10,000 Bitcoin. He facilitated the deal by ordering the pizzas for Laszlo and receiving the BTC in exchange.

How to celebrate Bitcoin Pizza Day?
As a yearly celebration of the first moment in history that a purchase was made using Bitcoin it is customary to: eat pizza! This happens on the 22nd of May, the date that the first thing (pizza) was bought using bitcoin. It does not matter if it is just a slice, or a whole pizza, or more. If it is homemade, store-bought, or delivered. Keeping to the original concept, die-hard enthusiasts will make sure that the pizza is paid for with Bitcoin.
Related questions
Where can you buy pizzas with Bitcoin?
Today numerous pizza deliveries offer pizza for Bitcoin.
Other options for purchasing pizzas with your crypto money are vouchers and 3rd party takeaway services.
How much Gold is one Bitcoin worth?
One Bitcoin is worth 488 grams of Gold.
Is the Bitcoin Pizza Index on this site realtime?
The values of Gold, Silver, Dollars and Euros are updated daily.